The following is the second part of a two-part series describing several critical use cases where Advanced Analytics can help teams make the right decisions to strengthen their overall posture and effectively manage risk.
(If you missed Part 1, covering DLP Investigations and the CISO Dashboard, you can read it here)
Data Governance and Privacy Dashboard: Visualizing Compliance
Data Governance leaders need to understand the movement of data in order to ensure compliance with different privacy laws. One of the most difficult regulations to account for is the European Union’s General Data Protection Regulation (GDPR). GDPR includes complex data privacy rules regarding the privacy rights of individuals. In order to prove that their organization is maintaining compliance, leaders must be able to show all the comings and goings of their data. The data flows are extremely important and difficult to produce for the Processing Records requirement of GDPR. Here’s how the Data Governance and Privacy Dashboard can help:
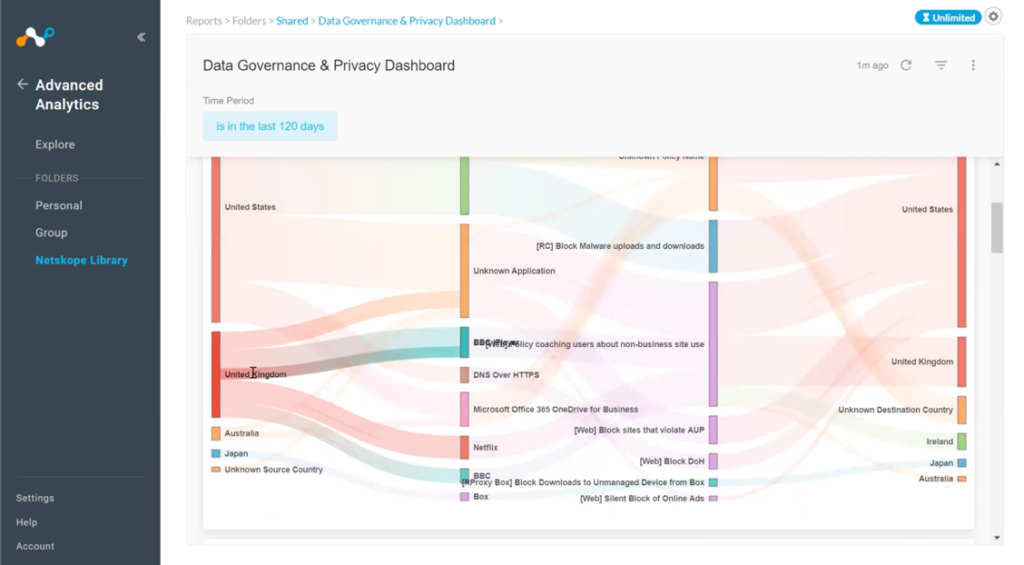
Data flow mapping This feature helps security leaders see where their data is coming from and going to per country within a set period. They can visualize what kind of data is flowing, where the source is located, and any destination events. For example, they can quickly follow a path and see that they’ve got data going through Microsoft 365 going to unexpected places. That’s something that would merit further investigation. Anyone in a governance role must also ensure that the organization isn’t violating any relevant privacy policies. This view helps leaders spot these kinds of potential issues, so they can then instruct the operations group to put the correct rules in place to prevent this from occurring. Double-clicking into any of these charts will produce detailed data for further analysis and action.
Destination countries This shows a regional breakdown of destination countries with high DLP alerts by number of files or by application views. This can help leaders spot any new or unusual applications and review the associated application risk rating.
Trending DLP alerts This offers leaders a better understanding of the current state of data leakage. They may want to know where they’re seeing different alerts and be able to investigate further. They also may want to know what specific regulations might apply to the data in question, such as payment card industry (PCI) standards.
Application risks To visualize the compliance risks presented by software in use across the company, governance leaders can look at data bytes uploaded and data bytes downloaded per application, as well as the top ten actions taken based on the number of alerts.
User risk This view offers a really interesting and useful investigation tool. It exposes any disabled accounts that still have activity and still accessing data. How are they doing that if they’ve been disabled? It shouldn’t be happening, but this report cross-checks expectations with reality.
Security Operations Dashboard: Preventing Data Leakage Day-to-Day
Security operations are the people that run the security infrastructure day-to-day. They are responsible for making sure the right rules are in place to prevent data leakage. When there’s a DLP alert, the security operations team will be the ones who actually look to see if there’s been an incident by taking a deeper dive into these instances.
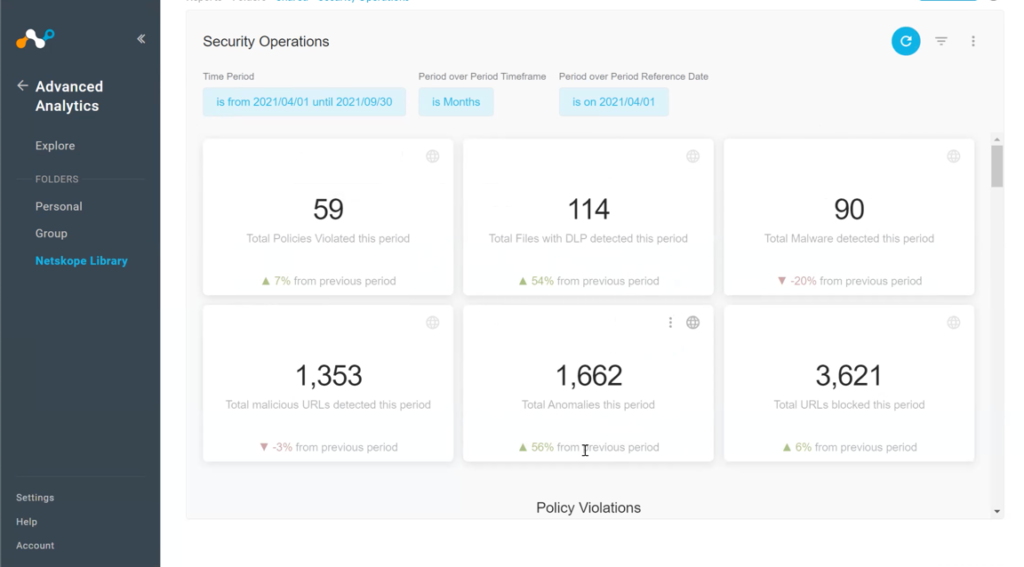
At its top level, the security operations dashboard summarizes things like the overall number of policy violations during the period, the number of files with DLP detections, malware detections, malicious URLs, and anomalies. Each category here can be clicked on for a more detailed and granular view of what happened over the evaluation period. Security operations leaders can then look at more visualizations of Netskope performance with regard to things like policy violations, user coaching/policy actions, and data protection.
It’s similar to the data that the CISO looked at, except with finer detail. For example, the views here may include user names and group name, which the security team needs but the CISO would not. If I’m an operations leader, I don’t want to embarrass anyone or possibly even violate a privacy policy. However, a per-user view is essential for helping security operations identify and prevent things like insider threat risks. For example, recent research shows that departing employees upload 3x more data to personal apps in their final month of employment.
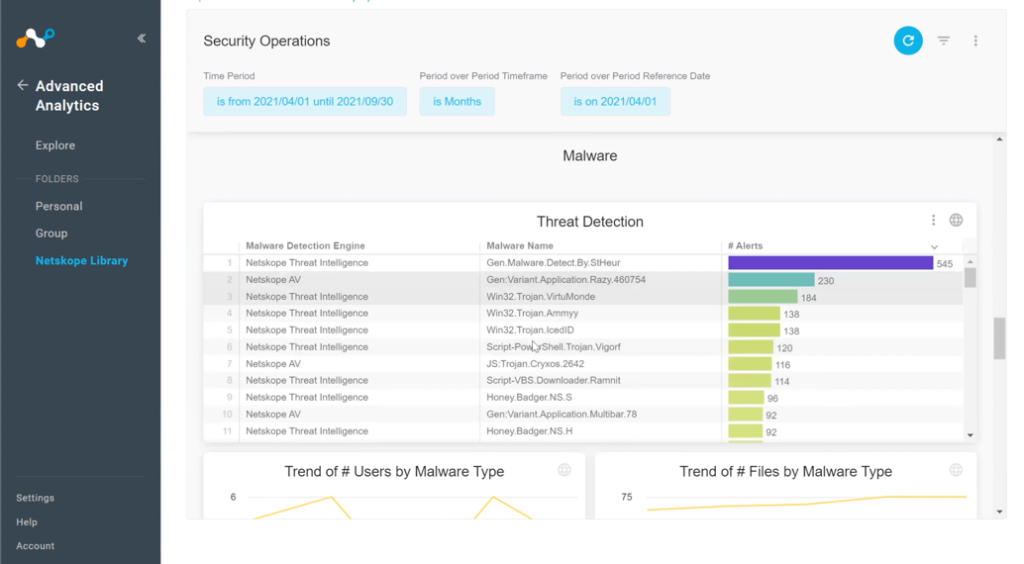
From a threat management perspective, these more granular views also show the names of different malware that were detected and where they came from. Similarly, leaders can also see by-volume lists of malicious URLs and anomalies that occurred over the period. The operations dashboard also includes the top-20 URLs with no alerts and the top-20 URLs that were blocked. So for a security person, this is very useful information for the day-to-day operations using Netskope.
Showing the Value of Your People, Processes, and Technologies
Risk management isn’t about risk elimination. It’s about understanding the tradeoffs and seeing what’s going on across your organization. The first thing you need in risk management is to be able to visualize it. If you can’t see a risk and understand it, then you can’t manage it. The ability to see what’s actually occurring in your environment is absolutely essential when it comes to managing risks. It’s also very useful when it comes to demonstrating the value of your security infrastructure—the people, processes, and technologies you have in place to protect the organization.
Netskope Advanced Analytics dashboards give leaders in different roles the ability to see, understand, and demonstrate the risks that they’re managing in their environments. Many senior executives simply don’t realize the organization is actively being attacked every day. If the company hasn’t suffered a breach, then the potential risks often remain invisible to business leaders.
Netskope Advanced Analytics demonstrates exactly how the solution has prevented actual malware, ransomware, and other attacks from impacting the organization. From a regulatory perspective, Netskope Advanced Analytics actively shows how you’re managing different privacy regulations and help prove compliance for auditors. You may have customer contracts that require this kind of proof as well—many contracts today require having reasonable security practices in place. Netskope Advanced Analytics also helps make your operations group more effective and efficient by putting the data they need to do their day-to-day jobs at their fingertips.