


Risk management doesn’t belong to one person or department at an organization. It’s a shared effort—partly because it touches on multiple roles at a company and partly because it is a massive and complex undertaking. Successful CISO’s use risk management visualization and reporting to provide a clear and easy way to understand the value of their security program. This is especially useful when demonstrating the value of the security program to executive teams and showing regulators and auditors you are actively managing risk.
Netskope Advanced Analytics is designed to help simplify risk management, data loss prevention (DLP), and compliance processes. Users in different roles can use one of several customized dashboards to dig deeper into more detailed information to see exactly what has been happening across the environment.
The following is the first part of a two-part series describing several critical use cases where Advanced Analytics can help teams make the right decisions to strengthen their overall posture and effectively manage risk.
Breaking down a DLP investigation
When you launch a DLP investigation, you may be reviewing millions of policy violations over a period of time. That might seem like an overwhelming number to start with. What you’re going to need to do is start breaking things down by getting more specific about what matters. Are there specific incidents we should be looking at? What kind of activity should we be seeing and expecting, and how does that compare to reality? What kind of data are we going to find?
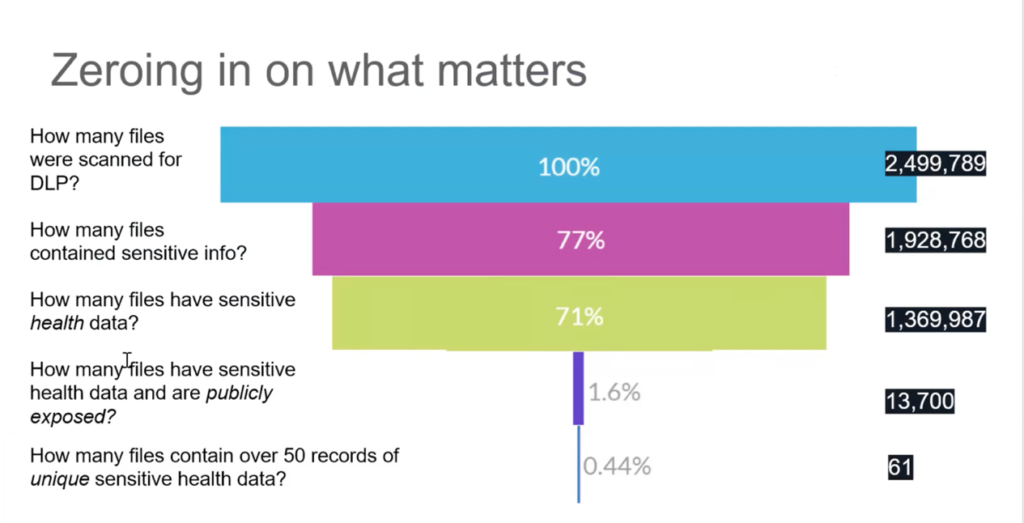
Let’s say during this period, you’ve scanned 2.5 million files for sensitive data using DLP. The first step is to ask, how many of those files actually contain sensitive information? Hopefully, that reduces the number by half a million. Let’s say this is for a healthcare organization—so, of those 2 million or so remaining, how many files contained sensitive health data? That reduces the number even further. After that, we might ask how many files had sensitive data and are publicly exposed? This reduces the total down to 13,700—because these files actually have some risk exposure. Then if we really want to pinpoint the most significant risk and narrow the scope even further, we can ask how many of these files contained over 50 records of health data? Only 61. A good analytics program will help you refine the question down to a manageable population and focus on the highest risk data.
This model is a theoretical starting point, which shows that in practice, you can prioritize your efforts by filtering out the noise and focusing on the data that you care about. Those files are the ones that you really have to worry about from a regulatory and risk perspective. Becoming more specific about what you really care about helps narrow the broader situation to a manageable place where you can optimize your staff’s time and put the right controls in place to prevent future events from occurring.
To aid in this process, we have a whole library of Netskope-created Advanced Analytics dashboards. This kind of structured, user-friendly information is extremely helpful from the perspective of being able to visualize what’s going on in your organization—whether you’re in a security leadership role, managing governance and compliance issues, or running security operations day-to-day.
CISO Dashboard: Demonstrating the value of data security
Netskope’s CISO Dashboard helps security leaders evaluate the value that the organization is getting from Netskope products. CISOs can take screenshots of this dashboard or export the data to include with other metrics to show leadership stakeholders what’s been going on in the environment over a specified period, such as over the last quarter.
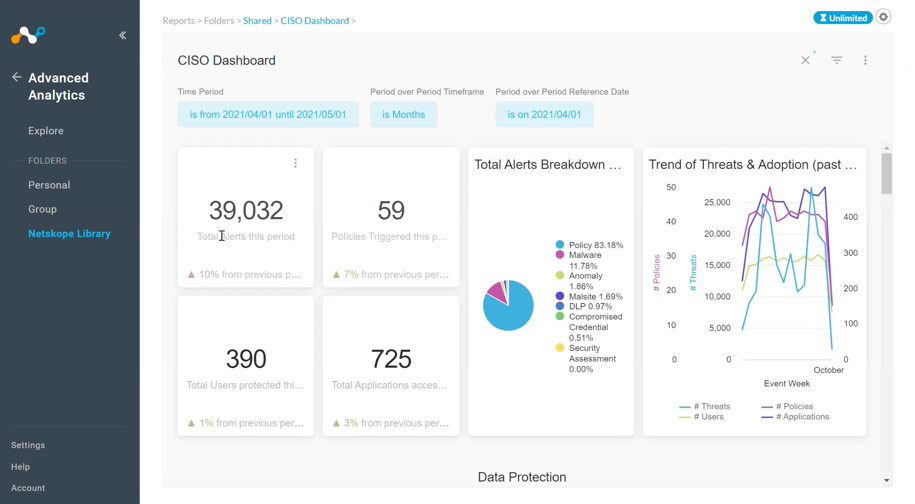
A top-level view that a CISO might want to take into a security steering committee essentially demonstrates what would be happening in the environment without data protection in place. It shows the number of users currently on the system. It shows the total number of alerts, as well as any defined subset of alerts that actually matter to the organization. The alerts breakdown chart—including things like policy alerts, malware, and anomalies—helps visualize where threats are coming from in proportion. The trend of threats chart shows how the volume of DLP threat alerts over the period increased or decreased from month to month.
After the summary, the more detailed views of the CISO dashboard contain subsets of data protection and threat management visualizations. Data protection shows how Netskope solutions are preventing data from leaking out of the organization. Threat management shows how security is preventing attacks like malware, phishing, and ransomware from impacting users. Let’s dig a bit deeper into each of those subsets:
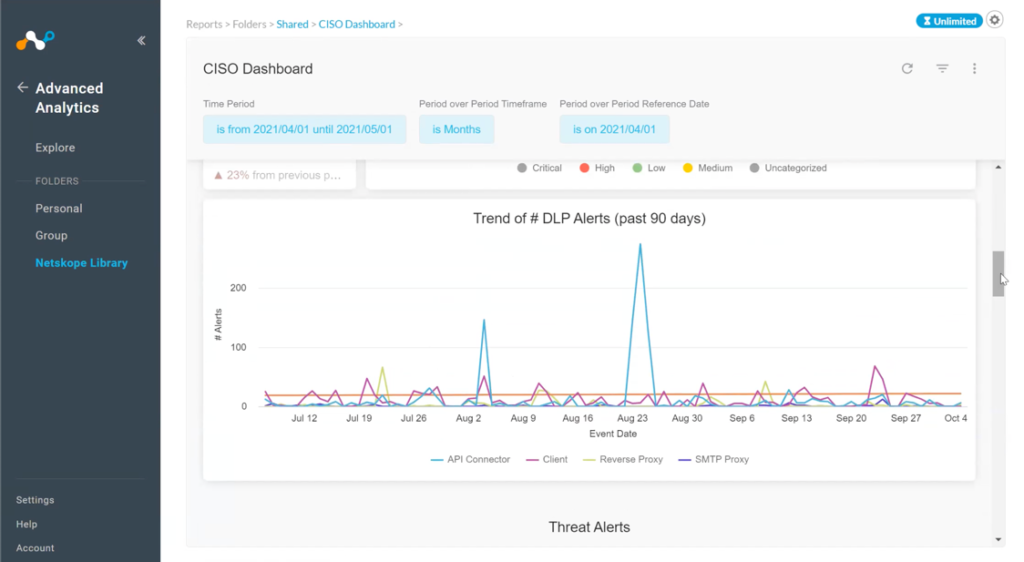
Data protection. We can start by looking at the different categories of top DLP alerts. This example shows that the majority of DLP violations were in cloud storage—including the level of severity (low, medium, high, and uncategorized). By clicking on a category, the CISO can drill down to explore these alerts in greater detail and even download the raw data into an Excel sheet or some other visualization tool.
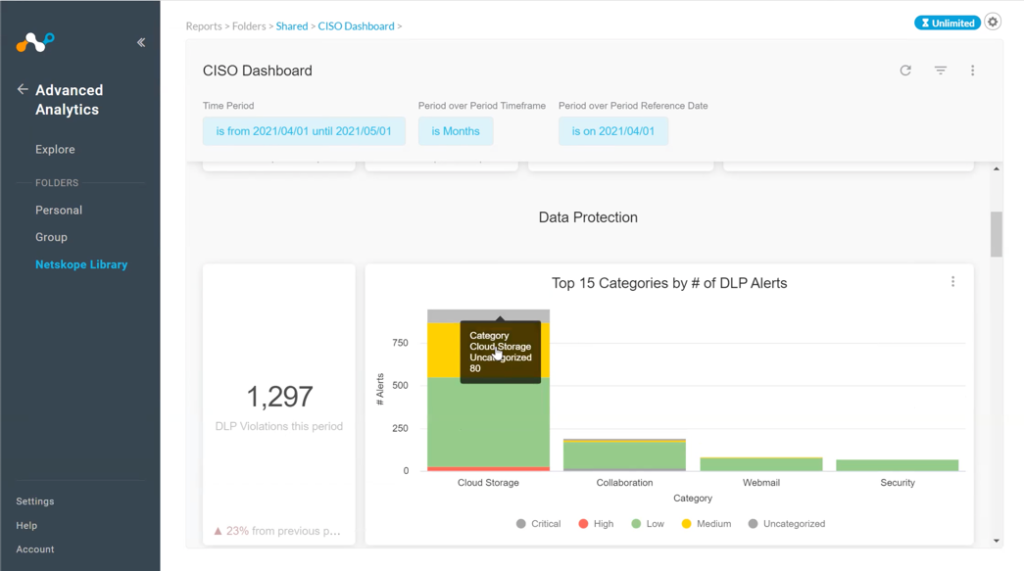
But the nice thing about Netskope Advanced Analytics is that almost everything can be done right here in the platform. I can look at my trend of alerts across time. I can investigate a specific item further and correlate day-to-day findings with my head of operations to locate the source of a particular issue.
Threat management. In these views, the CISO can explore different threat alert categories. Threat management includes several categories—such as cloud storage, security, non-business use sites, collaboration tools. Within each vector, CISOs can find more specific detail about the number of viruses found or how many malware events were blocked over the period.
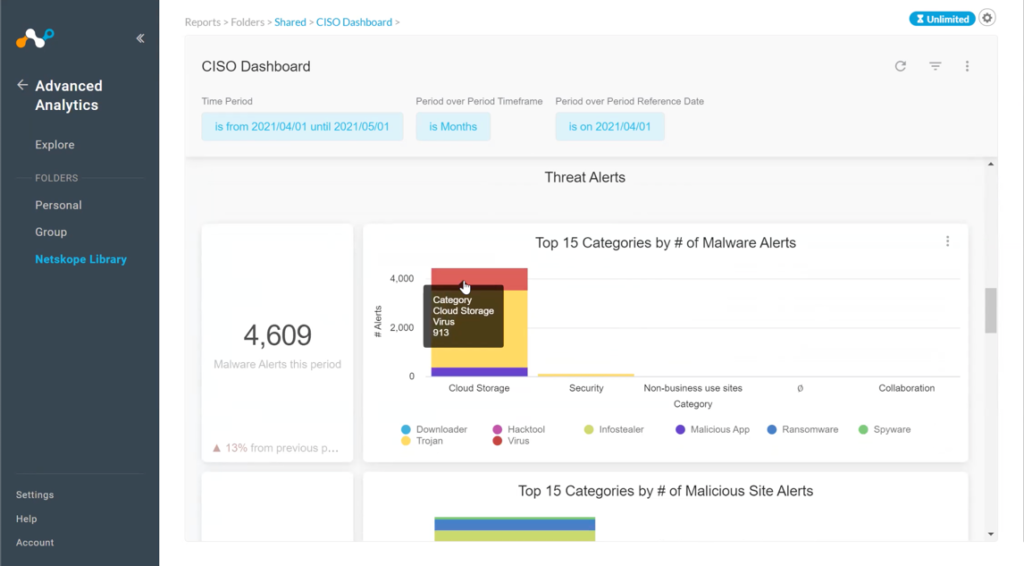
In this example screen, we see that the largest threat vector came from the cloud. This is consistent with recent research that shows 68% of malware was cloud-delivered, an all-time high. We’re now seeing phishing coming from common SaaS cloud applications—instead of just web or email sources.
CISOs can also look at data within more specific threat categories like malicious website alerts or which policies have been triggered over the period. Every time a policy blocks a user’s action, it means somebody was trying to do something that isn’t allowed. It might be a simple mistake but it could also be something malicious—and therefore worthy of further investigation.
A CISO or IT leader might also be interested in looking at overall network traffic—where in the world traffic is coming from and where it is going to once it leaves the network. What kind of traffic? How much traffic? Am I seeing any spikes that might indicate I have data being exfiltrated? This view can expose those kinds of indicators.
CISOs can also look at unmanaged applications—software that IT and security haven’t reviewed. Sometimes referred to as Shadow IT, user-installed or accessed applications definitely introduce risk, whether it’s social media, collaboration, cloud storage, or even security tools. This dashboard view helps track these instances and even see if there is sensitive data that might be going to these different applications.
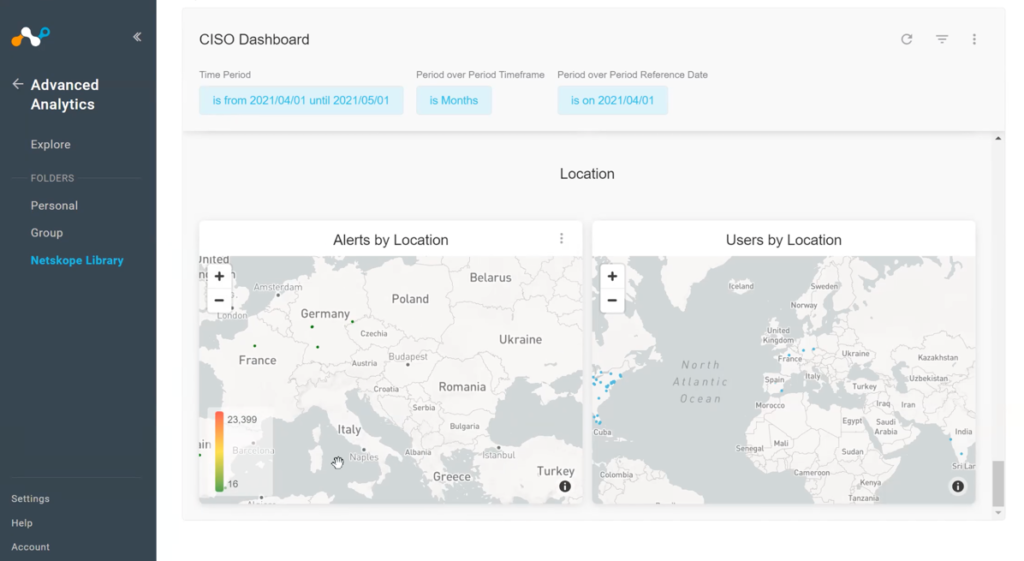
CISOs can also view by location to better understand where their data is coming from. What if you see activity in a city or region where you don’t have any users? Something like that would merit further investigation, even if the activity didn’t generate a high-priority alert.
Stay tuned for Part 2, where I will dig into the dashboards covering Data Governance, Privacy, and Security Operations, as well as how to use all of this data to demonstrate the value of your people, processes, and technologies.