


This is a common question for anyone delivering critical applications on public and long distance networks. Which metric should I focus on to maximize the speed of data transfer that support modern applications?
Network performance: throughput is what matters most for user experience
If you put yourself in the shoes of a user connecting to an application, what matters is how fast you see your application appear and how fast you can interact with it. What matters from a user experience:
- how fast you establish your connection to the digital assets that provide the different resources
- how fast you load them.
From a user point of view, network performance is about throughput!
How to measure throughput?
First clarification, many people mix up throughput and bandwidth. Although they are related concepts, they measure two different things.
- First, throughput is the speed at which two devices actually transfer data from one to another.
- Second, bandwidth corresponds to the maximum amount of data that can be transferred on a link.
We use the same unit for both metrics: bits or bytes per second.
While throughput can be measured easily, it is quite hard to measure whether this throughput represents the maximum speed a user can get. Quite often network operations will look at the drivers of throughput to identify potential bottlenecks.
What drives throughput?
In case of network degradation or outage, throughput drops. Monitoring network performance is a must to identify when the network is slow and what is the root cause.
Whichever tools you are using (packet analyzer like Wireshark, SNMP polling like PRTG or Cacti, Traffic loading, active testing) you need indicators that will help you understand whether your users can make the most of the network infrastructure to transfer data.
This article explains 3 key metrics of network performance (latency, throughput and packet loss), how they influence the speed of transfer depending on the protocol used (UDP or TCP).
- Latency is the time required to transmit a packet across a network:
- There are different ways to measure latency: round trip, one way, etc.
- Any element on the path used to transmit data can impact latency: end user device, network links, routers, proxies, local area network (LAN), server,…
- The ultimate limit of latency on large networks is… the speed of light.
If you wish learn more about latency and the different ways to measure it, I recommend you take a look at this article.
- Throughput is the quantity of data being sent/received by unit of time
- Packet loss is the number of packets lost per 100 packets sent by a host
Once we understand each of them right, let’s look at how they interact with each other.
Understand the impact of latency and packet loss on throughput
This can help you understand the mechanisms of network slowdowns.
The protocol used for the communication will impact how things work, so we have to analyze things in a different way for UDP and for TCP.
Measuring Network Performance on UDP
Latency has no impact on throughput on UDP
When using UDP, we assume that all packets sent are received by the other party (transmission control is executed at a different layer, often the application itself).
In theory or for some specific protocols (if no control is undertaken at a different layer; e.g., one-way transmissions), the rate at which packets can be sent by the sender is not impacted by the time required to deliver the packets to the other party (= latency). The sender will send a given number of packets per second, which depends on other factors (application, operating system, resources, …).
As a conclusion, latency has no impact on throughput on UDP.
Measuring network performance on TCP
Latency has a direct impact on throughput on TCP
TCP is a more sophisticated protocol: it involves a transmission control which checks the proper delivery of all packets. This mechanism is called acknowledgment: the receiver responds back with a specific packet or flag to the sender to confirm the proper reception of each packet.
TCP Congestion Window
As an optimization, not all packets will be acknowledged one by one; the sender does not wait for each acknowledgment before sending new packets. Indeed, the number of packets that may be sent before receiving the corresponding acknowledgement packet is managed by a value called TCP congestion window.
How the TCP congestion window impacts throughput
If we make the hypothesis that no packet gets lost; the sender will send the first set of packets (corresponding to the TCP congestion window) and when it will receive the acknowledgment packet, it will increase the TCP congestion window; progressively the number of packets that can be sent in a given period of time will increase (and so will the throughput).
The delay before acknowledgement packets are received (= latency) will have an impact on how fast the TCP congestion window increases (hence the throughput).
When latency is high, it means that the sender spends more time idle (not sending any new packets), which reduces how fast throughput grows.
The test values are very explicit:
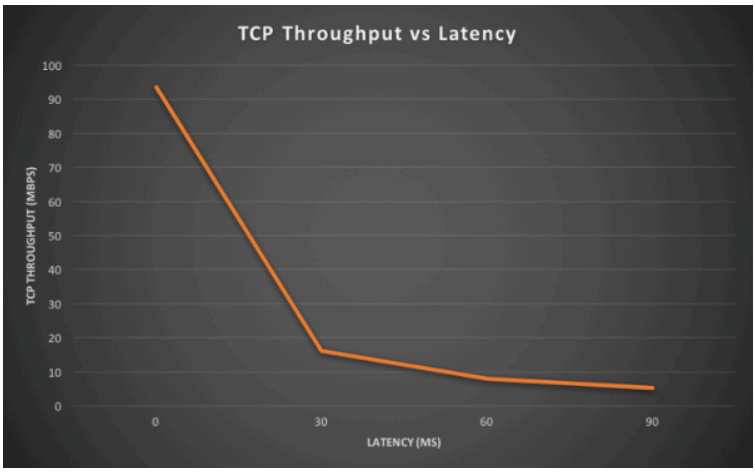
| Round trip latency | TCP throughput |
|---|---|
| 0ms | 93.5 Mbps |
| 30ms | 16.2 Mbps |
| 60ms | 8.07 Mbps |
| 90ms | 5.32 Mbps |
Retransmission and packet loss impact throughput on TCP.
How TCP congestion manages acknowledgment packets which are missing
The TCP congestion window mechanism manages missing acknowledgment packets this way: if an acknowledgement packet is missing after a period of time, the packet is considered as lost and the TCP congestion window is reduced by half (as the throughput – which corresponds to the perception of limited capacity on the route by the sender); the TCP congestion window size can then restart increasing if the client or server has received the acknowledgment packets properly.
Packet loss will have two effects on the speed of transmission of data:
- Packets have to be retransmitted (even if only the acknowledgment packet got lost and the packets got delivered)
- The TCP congestion window size will not permit an optimal throughput
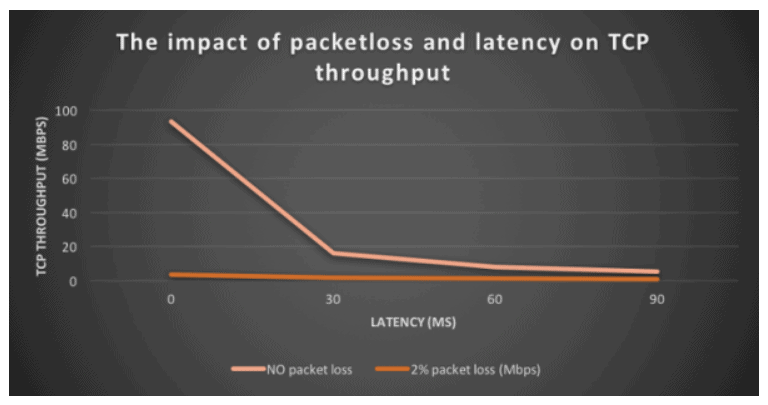
As an illustration, with 2% packet loss, TCP throughput is between 6 and 25 times lower than with no packet loss.
| Round trip latency | TCP throughput with no packet loss Round trip latency | TCP throughput with 2% packet loss |
| 0 ms | 93.5 Mbps | 3.72 Mbps |
| 30 ms | 16.2 Mbps | 1.63 Mbps |
| 60 ms | 8.7 Mbps | 1.33 Mbps |
| 90 ms | 5.32 Mbps | 0.85 Mbps |
This will apply irrespective of the reason for losing acknowledgement packets (i.e., genuine congestion, server issue, packet shaping, etc.).
As a conclusion, if you monitor network performance to maximize user experience your primary focus should be on packet loss rates.
Using Throughput and Latency Monitoring to Optimize User Experience
Accurately measuring throughput and latency on a network is essential for monitoring, debugging, and improving application performance and user experience. Understanding user transactions, server and client behavior, and the variety of hosts used in modern SaaS and web applications are vital for debugging the complex relationships between throughput, packet loss, and latency in TCP-based transactions and data transfers.
Monitoring latency and throughput using network-based tools is often a manual process that also places overhead on the network elements themselves. Synthetic monitoring and real packet analysis from a dedicated digital experience management platform can go beyond understanding throughput, packet loss, and latency to synthesize an accurate view of the real user experience as they access the applications they need to be productive.
It’s important to understand if throughput, latency, and packet loss actually impact the user experience before taking action and addressing packet layer issues with scarce IT resources, especially if they are not affecting end users’ ability to get things done. From this perspective, it’s important to understand not only the user experience but also the context of the user in the applications they are accessing, the connectivity they use to reach it, and any security functions that are being applied to the traffic.
This more holistic view provides the actionable insight required to prioritize user-impacting throughput and latency issues, supported by automated diagnostics and remediation that can rapidly resolve or preemptively prevent degradations from escalating to the level where they impact business performance.
Netskope’s proactive digital experience management (P-DEM) solution automatically measures the user experience of business-critical SaaS applications as well as the performance of the end-to-end underlying infrastructure that defines it.
P-DEM proactively helps your teams deliver an amazing user experience while maximizing security and performance without compromise. Learn more on the Netskope P-DEM page.