


In this article, we explain the main concepts of Traceroute and how it can be used to measure network latency and packet loss. We also address the main limitations of such a tool that makes it unfit for accurate measurements.
What do you use Traceroute for?
Traceroute is a very useful tool for network monitoring and problems diagnostics. With traceroute you can:
- discover the network path between a source and a destination
- measure the network latency to reach each hop on the path
- measure the packet loss at each hop
It is extremely useful to measure the network quality (congestions, …). It can also detect any network path variation that may occur through BGP peering/routing configuration changes.
How does Traceroute work?
The main principle of traceroute is shown hereunder:
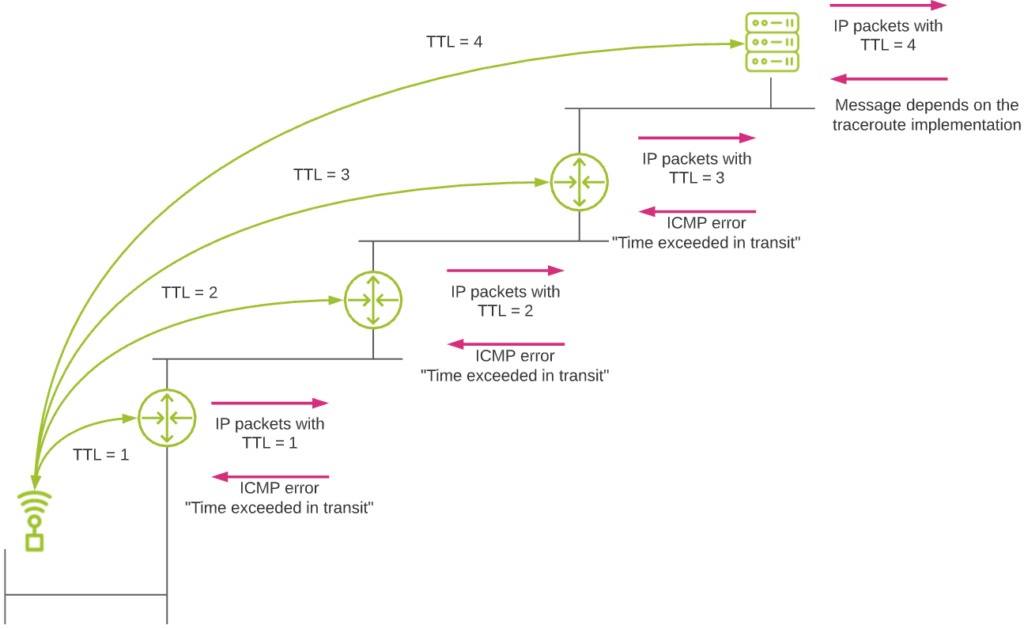
The whole traceroute principle is based on the TTL (Time To Live) field of the IP packet header. This field is mainly used to avoid loops in networks, where packets could be routed indefinitely in a loop under certain circumstances. When a host sends a packet on a network, its initial TTL value is between generally 32 and 255, depending on the operating system used. Each time the packet hits a router and must be routed, the TTL value decreases by 1. When a packet with a TTL value of 1 hits a router, this latter cannot route the packet anymore (it would mean a TTL=0). So it drops the packet (to avoid potential looping problem). It also informs the source about this by sending a specific ICMP error message back to the source (ICMP error message “TTL Exceeded In Transit”).
So traceroute relies on the fact that routers will send this ICMP error message back to the source in case of a TTL value reaching 1. When performing a traceroute, this is what happens:
- The source sends a first IP packet with a TTL header field value of 1.
- The packet hits the first router in the network path. The router drops the packet due to this TTL value and sends an ICMP error message back to the source.
- The source has discovered the first router! So let’s go to the next one. For this, it sends a packet with a TTL value of 2.
- The packet hits the first router, is routed normally, and the TTL values is decreased by 1 (new TTL value = 1).
- The packet hits the second router in the path. The router drops it due to the TTL value of 1. Again an ICMP error message is sent back to the source, which discovers the second router in the path.
- … and so on up until the packet reaches the final destination.
- The type of message this final destination will send to the source depends on the specific traceroute implementation used (see next topic).
Different traceroute flavors
With traceroute, the IP packets are not sent as is. They are typically transported in a upper transport layer protocol like UDP, or directly in ICMP packets.
Traceroute in Windows
The standard Windows implementation of traceroute uses ICMP as protocol to send IP packets.
Let’s see how it works in practice:
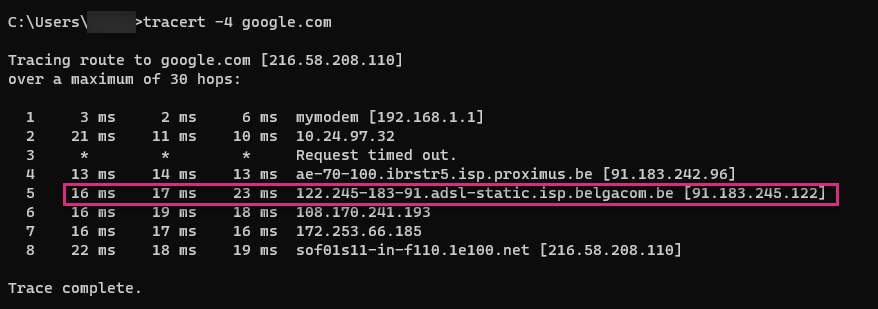
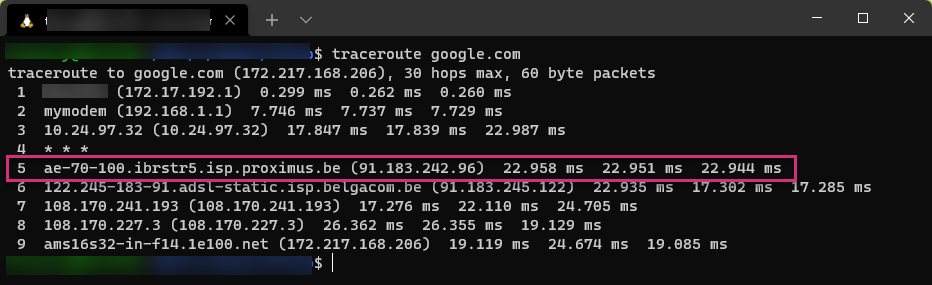
These pictures show a Windows traceroute to google.com.
One line corresponds to a discovered router. By default, a Windows traceroute sends three packets per hop. You can see this through the 3 network latency values provided per line.
In this example, the packet has reached the destination after 7 consecutive hops. The last line (8) corresponds to the final destination itself.
Let’s now see in details what happened by using Wireshark. We analyze the fifth discovered router.
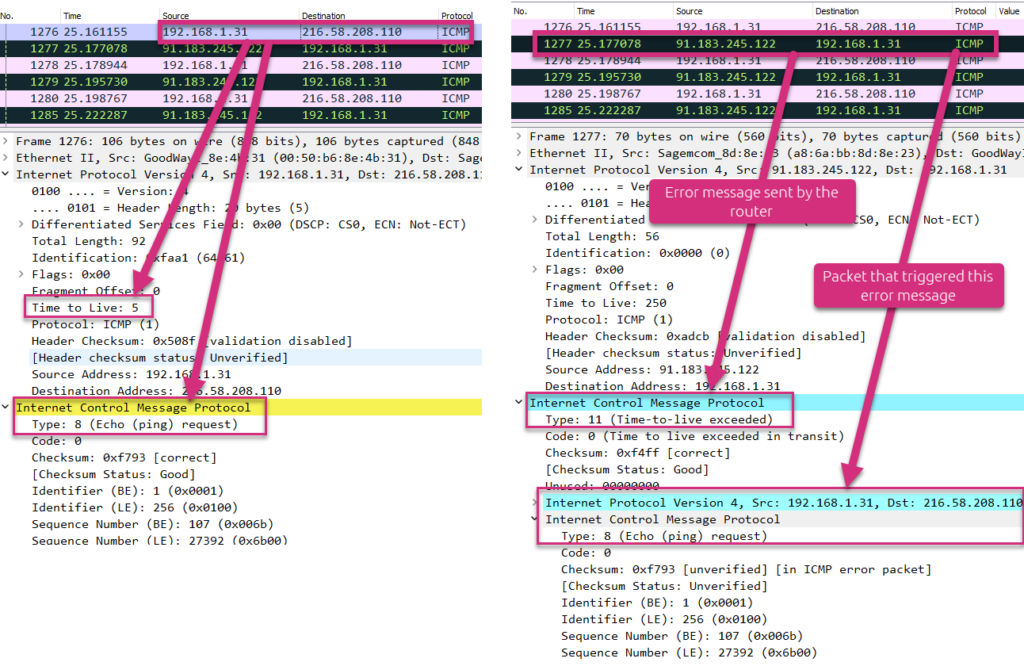
The left side screenshot shows that the source (192.168.1.31) sends an ICMP “Echo (ping) request” packet to the destination (216.58.208.110) with an IP header TTL field value of 5.
The right side screenshot shows the answer from the discovered intermediate router (91.183.245.122). This latter sends an ICMP error message “Time-to-live exceeded” back to the source. As additional data, it also sends back the packet that triggered this error message.
When the packet finally hits the destination, the packet does not have to be routed anymore. So the destination does not send any ICMP error message back to the source. This is shown hereunder.
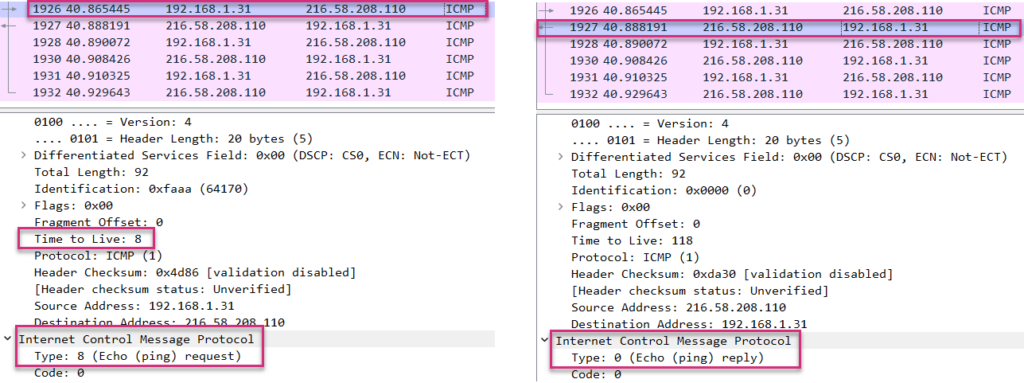
At the left side, you can see that the source still sends ICMP packets with incremental IP field TTL value (8 in this case). Nevertheless, as the destination does not have to route the packet anymore, it does not care about the TTL value. Instead, it responds to the ICMP Echo request solicitation by sending an ICMP Echo reply back to the source.
Traceroute in Linux
The standard Linux traceroute uses UDP as transport protocol to send IP packets.
Let’s see how it works in practice:
Without looking at more details, this looks exactly the same as a Windows traceroute: 3 tests per TTL value providing the network latency to each routing hop, up to the destination.
Let’s see what exactly happened this time:
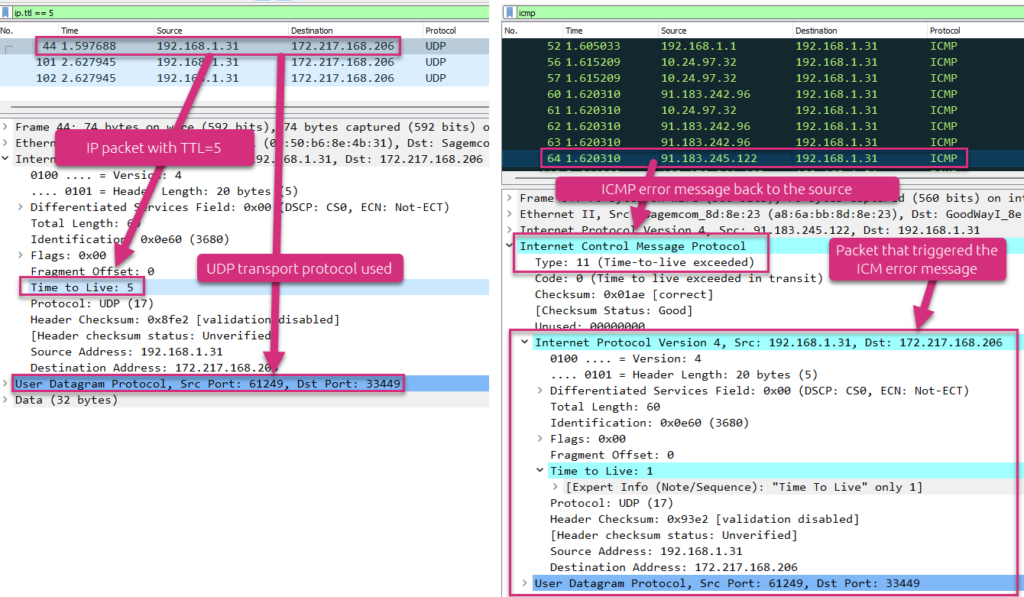
At the left side, you see the details of the fifth line of the traceroute, that is a UDP packet sent with an IP header TTL field of 5. At the right side, you see that an intermediate router sends an ICMP error message back (“TTL exceeded in transit”) to the source. You can check the reason of this ICMP error message from this ICMP packet to be sure this message has been triggered by the initial UDP packet.
When the packet finally hits the destination, the packet does not have to be routed anymore. So the destination does not send any ICMP error message back to the source. Nevertheless, as Linux uses UDP by default and not ICMP like Windows, the destination will not answer with an ICMP Echo reply back to the source. Instead, it answers by letting the source know it does not listen to the destination UDP port.
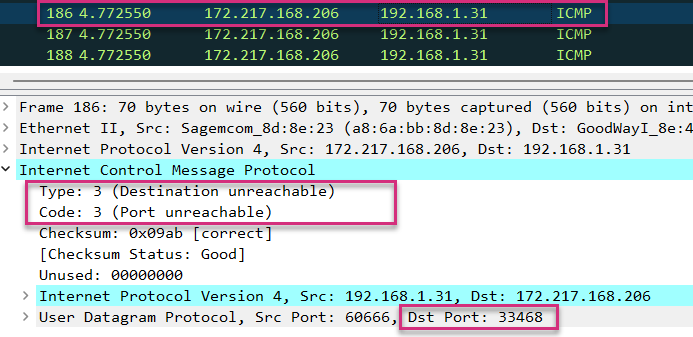
As you can see on the screenshot above, the final destination (172.217.168.206) sends an ICMP error message “Destination unreachable – Port unreachable” back to the source. It informs the source it does not listen to the destination UDP port (33.468 in our case).
Generally, traceroute based on UDP transport protocol uses destination ports above 33.435.
Main challenges/limitations with traceroute
If you want to quickly discover a route to a destination and have a first idea of the network performance, traceroute is certainly one of your best friends. Nevertheless, you should be aware of some major limitations that we can categorize as follows:
- nodes discovery
- path discovery
- performance metrics
Network nodes discovery
In order to identify all intermediate nodes up to the destination, they should send ICMP error messages back to the source. If one of them does not respond, it will not be identified. You can still know that there is a router in the path, but cannot clearly identify it.
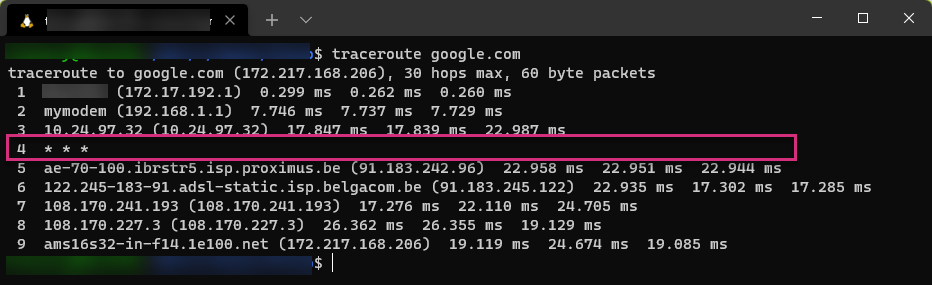
On the screenshot above, the fourth hop router is not identified. This is symbolized by the * .
Lot of network nodes will not respond to ICMP solicitation for security reason. A firewall may simply filter some traffic without sending ICMP packet back to hide its presence.
Network path discovery
As you know by now, traceroute is based on packet probes with incremental IP header TTL field value. So the following scenario may perfectly happen:
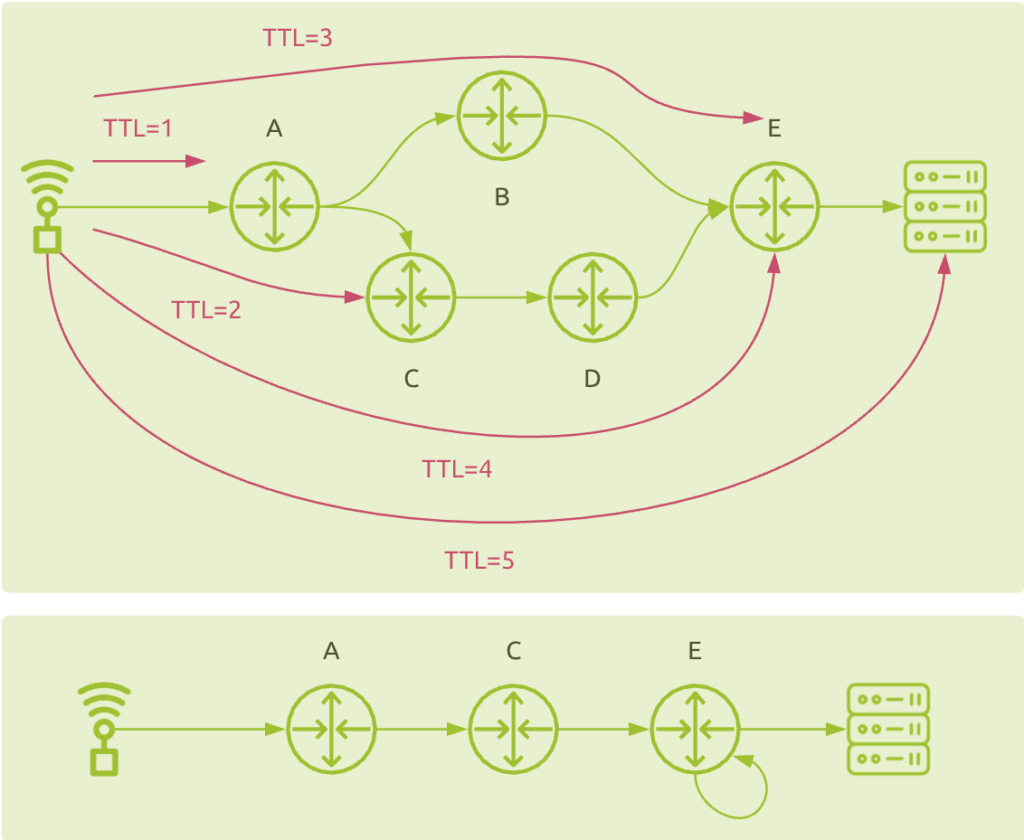
It shows why traditional traceroute does not handle load balanced network traffic correctly. Instead of detecting the load balancing between node B and C, the result may be a direct connection between C and E (from TTL=2 and TTL=3 tests), and a loop on node E (from TTL=3 and TTL=4 tests). You do not discover nodes B and D at all!
Network performance metrics
Intermediate nodes measurements
As previously explained, traceroute provides the network latency measurement from the source to each intermediate router. This is the time between the client sends the packet and the time it receives the ICMP error message back from the intermediate router. Unfortunately, the speed at which it all happens depends on the routing speed as well as the router’s ability to generate and send the ICMP error message. Usually, this kind of traffic is not considered to be of high priority. Routers will typically handle this kind of traffic with low priority compared to critical business applications flows. So the network latency measurement may not reflect the real production traffic performance.
From the number of missing packets back to the client, you may also deduce the packet loss value. But this has two limitations:
- The fact that an intermediate router does not send any ICMP error message back may be due to packet loss, but may be due to the fact it simply does not respond!
- Sending three probing packet cannot provide a high accurate packet loss measurement (losing 1 packet would mean 33% of packet loss! Ugh…)
End-to-end measurements
Measuring the network latency from the source to the target requires this latter to respond to source’s solicitation.
In a standard Windows traceroute implementation, the destination should not ignore/filter ICMP Echo requests packets and should send ICMP Echo reply back to the source.
In a standard Linux traceroute implementation, you should ensure that no service is running on UDP ports 33.435 and above, and also that this machine will send ICMP Destination Unreachable error message back to the source.
If for any reason the destination does not respond to any source solicitation, you’ll never be able to measure the end-to-end network latency with traceroute.
Using traceroute in a production environment
Traceroute is a fantastic tool to quickly discover network paths and have some idea of the network performance. Nevertheless, seeing the main limitations explained above, if you want to use this tool in a production environment, you would better opt for specialized solutions that address the major challenges you’ll encounter.
Multiple probing methods
As stated before, Windows uses ICMP and Linux uses UDP as ways to send IP packets. The nodes discovery level of accuracy depends on whether intermediate routers will respond or not. Furthermore, the network performance metrics will be much dependent on the way the different nodes handle the corresponding probing traffic. Finally, the end-to-end measurements require the target to respond to the source solicitation, which again, depends on the protocol used.
So far, we only mentioned ICMP and UDP as protocols used for that. But you can even use TCP or other techniques (like sending TCP ACK packets from the TCP handshake process). This is a good alternative for networks that simply filter UDP traffic.
So you should consider using multiple techniques and combine them to:
- ensure full path visibility up to the destination
- accurately estimate the network performance metrics
Specialized algorithms
The standard traceroute may provide you with totally wrong information as it cannot handle load balanced routes properly. To solve this problem you need to use more sophisticated techniques, like Paris traceroute. But it is not enough. You will need some additional specific algorithms and heuristics to efficiently calculate other metrics like packet loss.
Network path visualization
Having a list of nodes and corresponding IP addresses is a starting point.
But what you really need is a clear overview of the different BGP ASes that are being traversed so that you can identify the AS owners (ISPs, CSPs, …) that do not provide adequate performance and take corrective actions, like changing your BGP peering configuration.
Network path changes detection
Discovering the network path today is not enough. It may change tomorrow due to BGP routing modifications or specific network conditions. So you need a solution that enables you to constantly monitor network paths, stores the data at global scale, and provides a way to quickly visualize any deviation from the baselines.
A real example
The following screenshot shows a network path between an enterprise site in Singapore and a monitored digital service. On the “Round Trip over Time” graph, you notice a decrease in network latency. Why is this?
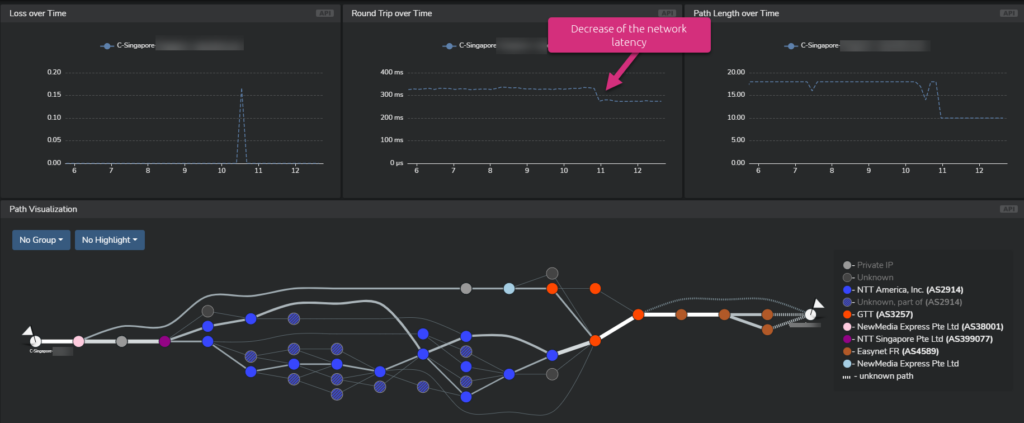
Let’s first have a look at the network path as it was before this latency decrease:
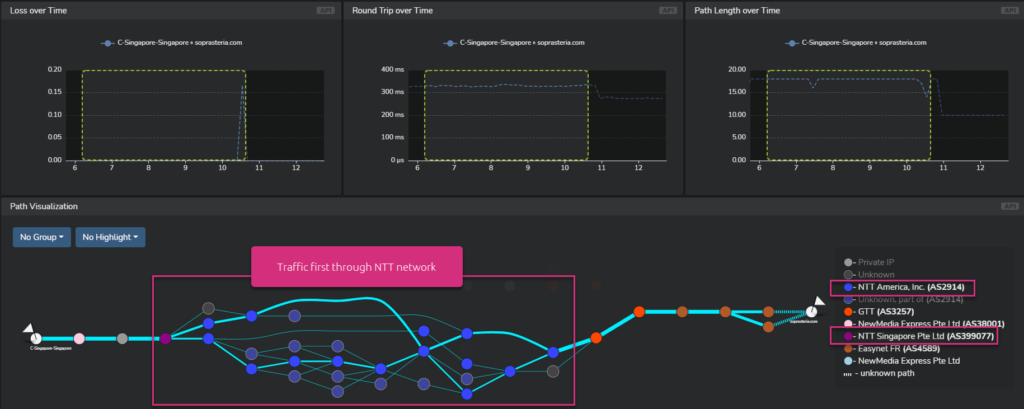
You can see that the first traversed network provider was NTT.
Now let’s have a look at the network path for the period of network latency decrease:
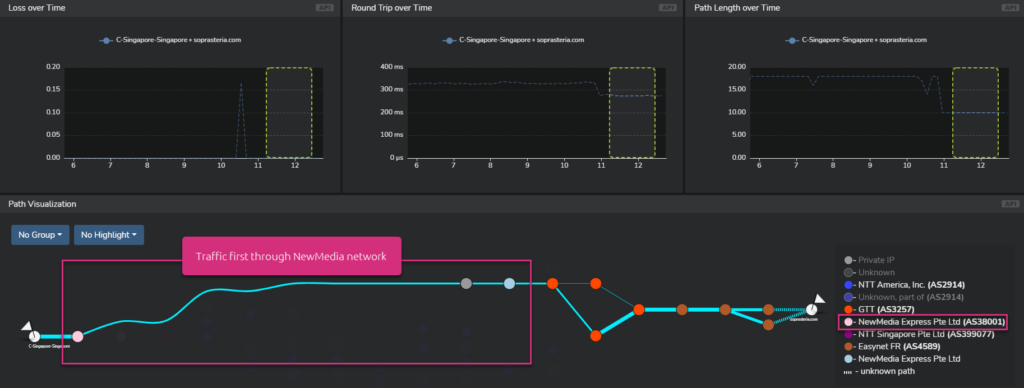
This time, the first traversed network provider was NewMedia. And you can also see that the number of hops drastically decreased as well.
So in this specific case, peering in priority with NewMedia may certainly be a good idea.
Using DEM to Monitor Latency
Accurately testing network latency is fundamental to monitoring, troubleshooting, and enhancing the performance and user experience of applications. Traceroute is an effective tool for quickly identifying network paths and gauging network performance. Though you can run basic latency tests using traceroute commands on any PC, it’s important to recognize its limitations:
- Inconsistencies in latency measurement, attributed to how ICMP test packets are processed by routers and hosts.
- It only indicates round-trip time (RTT) latency, limiting the evaluation of latency in a distinct traffic direction.
- Traceroute doesn’t measure packet loss, necessitating another method To capture this important metric.
- Traceroute only maps the current network path, which can vary due to factors like BGP routing adjustments or specific network circumstances.
Given these constraints, for those considering Traceroute in a production setting, it’s advisable to consider a more comprehensive offering that effectively addresses these challenges. The ideal solution should empower continuous tracking of network paths, maintain the data on a global scale, and allow rapid visualization of any discrepancies from standard benchmarks.
At Netskope we use a streamlined yet sophisticated approach to assess network latency, internet latency, and latency for application and cloud security. Our Proactive Digital Experience Management (P-DEM) solution distinctively evaluates per-hop latency and its impact on real user experience, leveraging diverse perspectives for unparalleled precision:
- A SMART combination of synthetic monitoring augmenting real traffic analysis.
- Essential device health indicators such as CPU, memory, disk, and network performance and usage.
- Comprehensive insights acquired from our security proxies situated in the NewEdge private cloud.
Furthermore, beyond just measuring latency from device to application, Netskope can identify the latency source anywhere along the path, whether it’s the PC, browser, WiFi, ISP, SD-WAN, Netskope SASE, cloud networks, or the app hosting efficiency.
Consult these these resources to learn more about digital experience and latency monitoring: