I am often struck by the similarities in the skill set required for both parenting and cybersecurity. With children—as with employees—it is much easier to keep everyone safe if you have a little bit of visibility into what’s actually going on. The hardest child to parent effectively is one who shuts themselves away in their bedroom, operating in isolation and giving no clues as to the risks they may be exposing themselves to. If you respond to this teenager-imposed information blockade by imposing your own hefty limitations on their accesses and freedoms it rarely goes down well (and in all good 90’s TV dramas, it tends to result in the teen climbing out of the window).
Apply this same approach to cybersecurity policy and a team of grown up employees is just as likely to find a metaphorical window to escape through. No one likes heavy handed blocks (and most people find ways around them), but if you don’t know the risks to which employees are exposing corporate data and systems, it is tempting to just lock everything down. Lack of visibility inevitably leads to paranoid and heavy-handed blocking policies, which impact productivity with equal inevitability.
So how on earth do you get your teen to open up? Well, this isn’t the blog for that. At this point, I will dive into the cybersecurity side of this analogy because, while the skills are similar, it’s here that I am more confident in my expertise!
The first thing to consider is exactly what question you want to answer and what insights you need to be able to do this. This is a logical but often forgotten first step before you make any efforts to actually pull the data together. This “question before answer” structure can help address the all-too-real challenge that huge volumes of data can quickly become overwhelming if the collation is undirected.
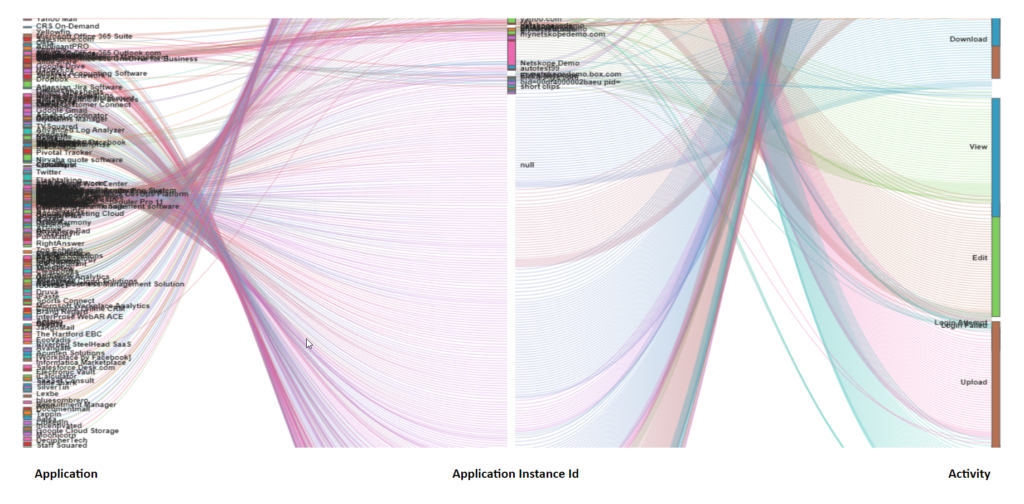
As an example, raw information on data movement looks like this, and it is unusable:
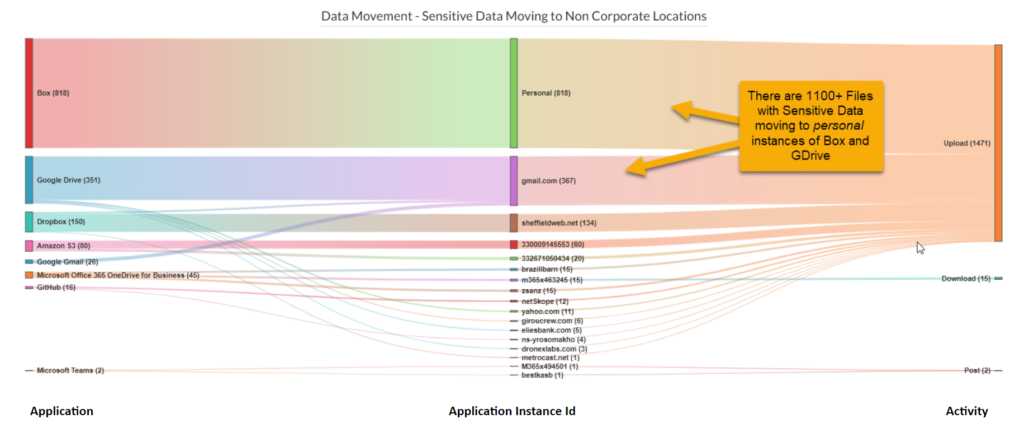
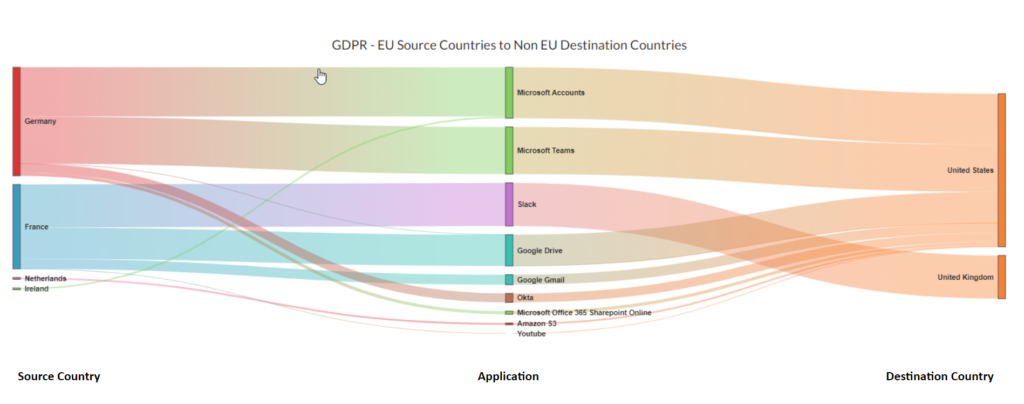
Now look at the image below. This is a more coherent diagram because it has been focused by asking a question specifically pertaining to “Sensitive data moving to non-corporate locations.” As a result this diagram delivers actionable insights:
So what are we actually talking about when we say “actionable insights?”
Just as a parent is capable of making risk assessments and tweaking rules depending on whether their child is at a sleepover in a home where the parents are well known vs out at a concert in an unfamiliar city, so security policy can look for insightful indicators around data flows, applications in use, data types, and access methods, and then use these to determine organizational risk exposure and design policy.
Which of these would be useful for you to know as you determine your risk exposure and decide which policies should be implemented?
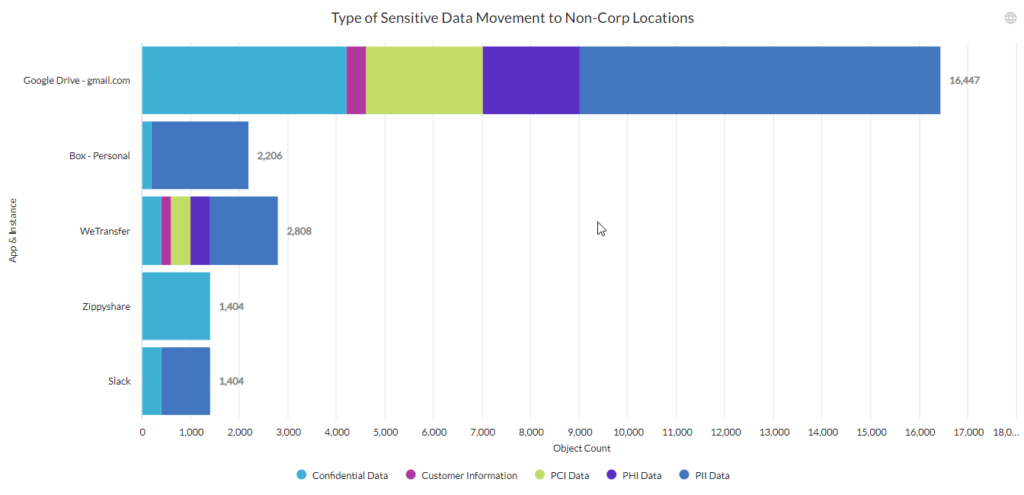
- “Did you know you have 20,000 files/documents with sensitive data moving to WeTransfer and personal instances of GDrive and Box?”
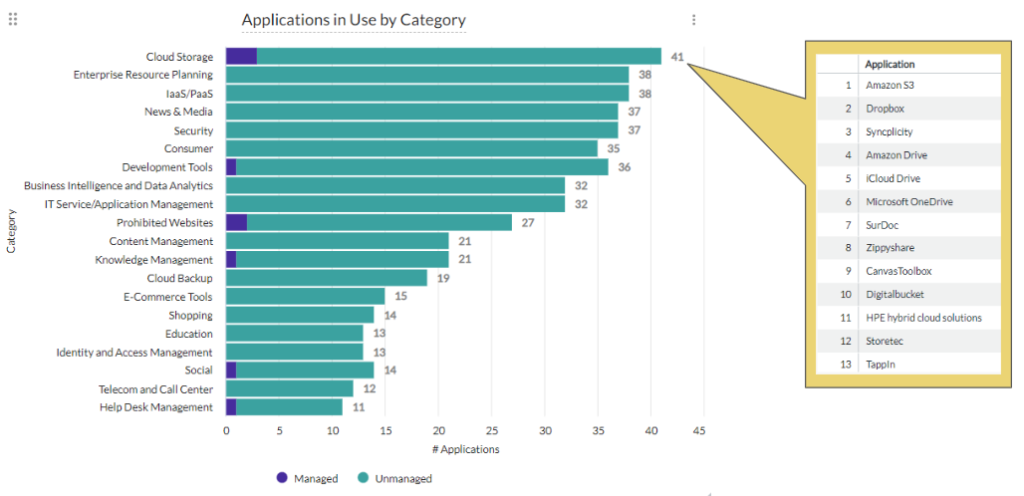
- “Did you know you have 41 different cloud storage apps in use across your organization, but only four of them are ‘managed’ having been through the organization’s required security and procurement checks?”
- “Did you know that 94% of your managed app data traffic flows through the US, even though it originates in Germany, and is ultimately stored in Germany?”
- “Did you know your users have unmet business needs that are currently being hindered by security policies blocking certain actions (e.g. they have justifiable corporate reasons for converting documents to PDF formats)?”
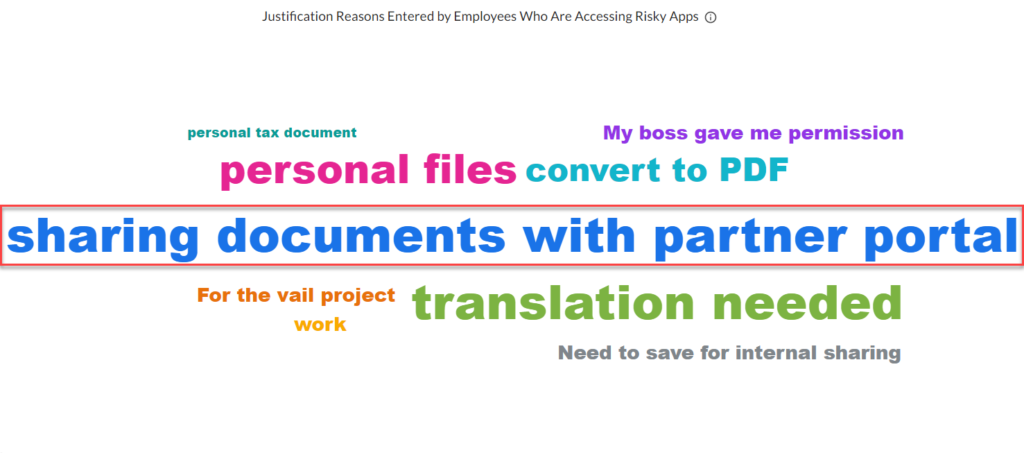
These are just some examples of the insights you can derive; and the way these can inform policy (and conversations with key cloud app partners) are pretty obvious.
The most powerful data analytics tools don’t just extract data patterns, they also allow you to drill down into the data when you observe something that catches your eye.
For example, the first run at the data might show that you had a huge surge in document downloads from the cloud in the first week of December. That’s worth noting, but it is not an insight—it’s like shining a torch into a specific point in a dark garage—it shows you something that looks very much like part of a monster, but you need to return to the data (flick the light switch) to illuminate more than this isolated fact and determine whether it is indeed a monster or just a pile of harmless car parts.
And so you slice and dice the data in other ways. Was this surge from a single user or a particular group? Did the documents include anything tagged as sensitive (e.g. did it include PII)? What happened after this download? Were the users moving the data onto USB, perhaps they re-uploaded to personal cloud instances? When the users were served up a “just-in-time” note about this being an ill-advised action which exposed the organization to data loss, did they change their behavior? This is how you gather insights from raw data and how you can determine when policy changes might be required. It is also how you can usefully present the information to senior stakeholders in an intelligible manner.
And talking about presenting information to stakeholders, there’s a big difference between reporting and analytics. Reporting tells you something happened, but analytics requires the ability to be able to get to the bottom of why it happened, and whether you should be doing something about it. This is a much more useful conversation to have with leadership teams. While most security technologies include essential reporting capabilities, analytics is a much more valuable function.
I have (hopefully) shed light on why data insights are useful, and how they can lead to a more adaptive and effective security policy. But what I have kept from you up until this point is an ugly truth… data analysis is rarely straightforward. Data Analysts spend about 90% of their time wrangling data (identifying it, accessing it, preparing it, cleaning it…) and only 10% actually analyzing and delivering insights. This is our ugly truth and one we are constantly seeking to address. This problem is something we commit some serious energy to at Netskope, and my job—as Head of Analytics Strategy—is in large part about “how do we make sure our customers get to the insights consistently, and faster?” We aren’t doing too badly either, which is why Netskope Advanced Analytics recently won the Comunicaciones Hoy award in Spain for the best ‘Big Data and Analytics’ technology in 2022.


 Voltar







 Leia o Blog