


Why test internet latency? Application latency has a large impact on user experience for web sites and applications. Testing latency provides insight into its origin. With the right tools you can determine if latency is caused by the internet or your network, your device or browser or the server or site you are connecting to. This article explains how to check internet latency, how to test latency and improve the user experience of your employees and website visitors.
We will explain how five common network latency test tools work so you can choose the right one to test the latency of your internet connection and application. Online latency test sites are not usually precise enough to reveal the cause, so let’s take a look at how to test latency like a pro!
Top 5 Network Latency Test Tools
The most common internet latency test tools are:
- Ping
- Traceroute
- OWAMP
- TWAMP
- iPerf
Each has their strengths and weaknesses when testing latency. Some network latency tests work well for internet latency, others are best suited to testing local or private network latency.
Ping and Traceroute Latency Testing
Ping and traceroute are latency tests you can perform from your PC. They can be used to test online and internet latency as well as to check latency in your local network.
Measure network latency with PING
Ping is the simplest approach to test network latency from your computer.
How ping works
Ping is a standard latency test tool available on all operating systems. It measures the round trip time (RTT) between your PC and the target you specify (domain or IP address). RTT is the time it takes for the ping packet to reach the target plus the time it takes to return the result, so it measures the total latency to get a response from a server, PC, router or internet site.
To use ping open a console or terminal window and type ping domain. If you provide a domain name (like google.com) ping will first verify that it can resolve the domain and report back its corresponding IP address. You can alternatively provide the IP address of the server you want to test latency to.
The following example shows that the minimum, maximum and average round trip latency times are 20ms, 24ms and 21ms respectively.
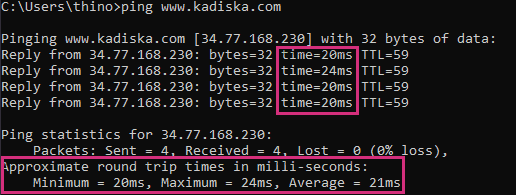
By default, a ping command tests latency by sending four ICMP Echo Request packets to the destination which responds back with ICMP Echo Reply packets which are then used to calculate latency.
Advantages
The main advantage of this method is its simplicity. You do not need anything installed on your PC to test internet latency to any domain, or network latency to any IP address. It’s a good way to check if latency is a problem.
Limitations
Unfortunately, simplicity often comes with limitations.
First, for security reasons, ICMP packets may be blocked by an intermediate firewall. In this case, the target will never respond to your ICMP Echo Request and you will not be able to measure the network latency.
Second, the ICMP protocol may be handled with low priority by intermediate routers, distorting the accuracy of the latency measurements.
Finally, as ping measures the round trip delay you cannot differentiate the network latency in either direction (e.g. upload vs. download direction internet latency), so it is not possible to detect directional network latency problems. Directional latency problems regularly affect web conferencing applications like Zoom, Microsoft Teams and Google Meet.
Measure network performance with Traceroute
As an alternative to ping, you can check network latency with traceroute. This approach to testing latency is also available on all operating systems. From a terminal window, use these commands:
- tracert command on Windows machines
- traceroute command on Linux and Mac machines
How Traceroute works
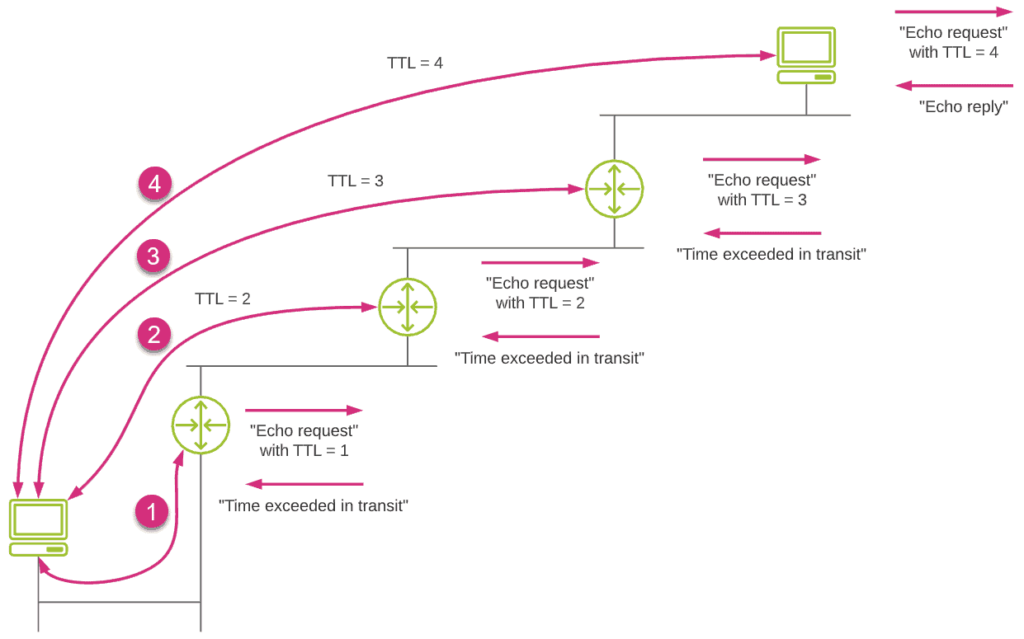
Traceroute uses the TTL (Time To Live) field of IP packets to discover intermediate routers between a source and a destination. This technique tests latency to each hop along the network path and identifies them by IP address as it tests. This provides more insight into the origin of network latency problems.
The principle is simple. Each time a router forwards a packet its corresponding TTL field value is decremented by 1. When this value reaches 1, the router drops the packet and sends an ICMP Error message “TTL exceeded in transit” back to the source. This mechanism is used to prevent packets from looping indefinitely, which may cause the whole network to crash. In this case traceroute is taking advantage of this behaviour to check latency to intermediate locations.
Receiving ICMP packets back from intermediate routers allows the source to discover them as well as measure the network latency to reach them.
In its simplest form, traceroute uses ICMP protocol (Echo Request) for sending packets to test latency and discover the hops along the network path. Some routers may not respond to ICMP packets for security reasons. This means that latency testing will stop at this point, preventing you from checking latency end-to-end. You can see this in the image below.
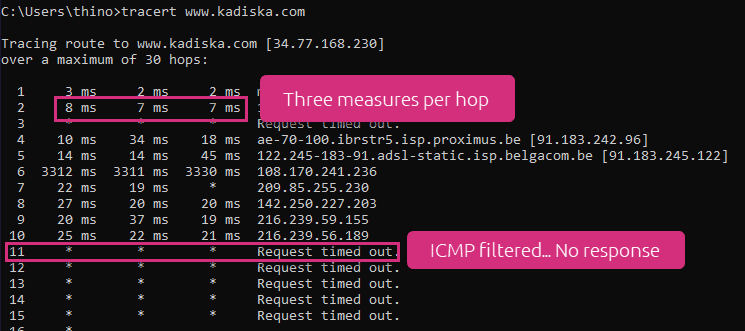
You can also see that traceroute sends four packets per hop by default on a Windows platform.
More advanced implementations also use UDP or TCP transport protocols, and offer more options (packet size, probe interval, number of probes per hop, …). This ensures that your latency tests are better aligned with real network traffic and the way that it’s routed. Nevertheless, all traceroute implementations still rely on the ICMP Echo Reply messages that are often processed with much lower priorities, impacting accuracy the same way ping latency tests are affected.
And just like ping, testing latency using traceroute returns the round trip delay. If your network connection is asymmetrical (like most broadband connections are), network latency measured by traceroute won’t allow you to check for directional network latency issues.
Advantages
The main benefits of traceroute are:
- Easy to use and implement
- Gives a representation of the network path
Limitations
Traceroute comes with some limitations:
- If traceroute uses ICMP, limitations affecting ping are also valid
- You can only check latency round trip
Advanced approaches to testing latency
More advanced synthetic latency testing techniques get around the problems introduced by testing latency with low priority ICMP packets, as well as the limitation of round trip latency measurements. Here are three of the most common.
OWAMP One Way Network Latency Testing
OWAMP stands for One-Way Active Measurement Protocol. It is standardized under RFC 4656.
Compared to ping/traceroute, OWAMP tests network latency in one direction and does not rely on the ICMP protocol to calculate latency.
How OWAMP works
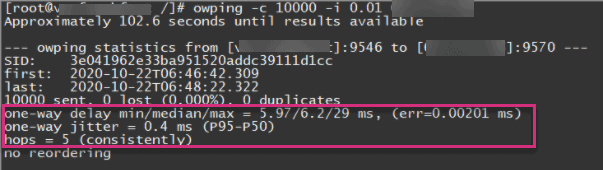
OWAMP provides more precise network latency measurements by using UDP packets to test latency in one direction. You can fine tune your latency tests to better align with your specific requirements and use case. For example, you can define the size of latency test packets, the interval between two consecutive packets in a test, as well as the number of packets per test.
And of course, it is easy to check if network latency is occurring in only one direction by performing an OWAMP latency test in each direction.
OWAMP latency test results are also more detailed than ping or traceroute. It provides the minimum, median, and maximum value of the network latency between your source and the targeted destination (as well as other useful data like one-way jitter and packet loss).
OWAMP latency testing also supports security authentication mechanisms.
So is OWAMP the ultimate way to test internet latency?
The answer is “Yes”, but only if you have OWAMP testing capabilities at both ends of the network connection. OWAMP requires the implementation of a client/server latency test architecture. A piece of software must be installed on both the source and the destination for the OWAMP latency test to work. Moreover, to get accurate one-way latency test results, both latency test points must have properly synchronized clocks. Some telecom-grade routers have native OWAMP support built in, but clock synchronization will still require a time server supporting a standard protocol like IEEE 1588v2 (PTP).
One more limitation: OWAMP does not properly support NAT (Network Address Translation) configurations, preventing you from checking latency across some internet / private network boundaries.
Advantages
- One way network latency measurement
- High accuracy latency results
Limitations
- Need OWAMP latency test capabilities at both ends
- Requires proper clock synchronization to measure one-way latency
- No NAT support
TWAMP for bidirectional latency testing
TWAMP, which stands for Two-Way Active Measurement Protocol, is a variation of OWAMP. It is standardized under RFC 5357.
If you want to check latency in both directions at the same time, TWAMP is the answer.
How TWAMP works
TWAMP tests latency by first using TCP to establish a connection between the source and destination, then uses UDP packets to monitor the latency. It also uses a client/server architecture and requires that the endpoints support the TWAMP latency test protocol.
As a variation of OWAMP, TWAMP share the same latency test advantages and disadvantages:
Advantages
- One way network latency measurement
- High accuracy latency results
Limitations
- Need TWAMP latency test capabilities at both ends
- Requires proper clock synchronization to measure one-way latency
- No NAT support
Using iPerf to test network latency performance
iPerf, now in its thirdversion (iPerf3), is complementary to OWAMP and TWAMP. However, iPerf doesn’t test latency, as it is primarily designed to test throughput and packet transmission. iPerf is the technique frequently used for network speed testing by a variety of network test tools online.
How iPerf works
iPerf also uses a client/server model where data can be analyzed from both ends. iPerf measures throughput, jitter and packet loss.
Advantages
- iPerf can use UDP as well as TCP to test network performance
- Configurable parameters mean tests can be aligned to a specific use case
- iPerf provides throughput information
Limitations
- iPerf requires a client / server implementation (i.e. on both ends)
- iPerf doesn’t test network latency
Testing Latency – Summary of testing approaches
These five methods to test network latency and internet latency each offer advantages and disadvantages. This table summarizes these common techniques so you can pick the right test approach for private network latency testing vs. checking online or internet latency, for local networks or WANs.
In short, there is no best way to test latency. The test tool you pick should reflect your needs, as well as your ability to instrument both ends of the connection.
| Latency Test Method | Latency Metrics | Test Implementation | Advantages | Limitations / Drawbacks |
|---|---|---|---|---|
| Ping |
|
|
|
|
| Traceroute |
|
|
|
|
| OWAMP |
Minimum, median and max values |
|
|
|
| TWAMP |
Minimum, median and max values |
|
|
|
| iPerf |
|
|
|
|
How to Test Latency – Conclusions
Being able to correctly test network latency is a key aspect to monitoring, troubleshooting and optimizing the performance and user experience of applications.
You can do simple latency tests with ping or traceroute commands from any PC, but bear in mind that these techniques suffer from some significant latency test limitations:
- Poor latency measurement precision due to the nature of ICMP test packet handling by routers and hosts.
- Only reports RTT latency, preventing ability to check latency in a specific traffic direction
On the other hand, if you manage both ends of the test a better option would be to use OWAMP or TWAMP to test latency. The measurements will be more precise, and you will be able to detect latency problems in each direction independently. It’s not easy to implement and orchestrate these latency tests in a distributed, complex production environment, so it’s typically used only by telecom service providers where network latency is critical to performance of their production networks.
At Netskope we find network latency, internet latency, application and cloud security latency a fascinating topic! Our Proactive Digital Experience Management (P-DEM) solution uniquely measures per-hop latency and its impact on real user experience by combining multiple vantage points for exceptional accuracy:
- a SMART combination of synthetic monitoring augmenting real traffic analysis
- device health metrics including CPU, memory, disk and network performance and utilization
- deep insight from our security proxies hosted in the NewEdge private cloud
This approach provides more than latency measurements from device to app, it can also pinpoint the source of latency at any point in between, such as PC, browser, WiFi, ISP, SD-WAN, Netskope SASE, cloud networks, or application hosting performance.
Learn more about digital experience and latency monitoring with these resources: