The COVID-19 pandemic caused an abrupt and dramatic shift to remote work that has lasted five months so far and is expected to continue into 2021 as companies like Google have extended their work from home policies through July 2021. In this blog, we examine how geography and industry effect who works remotely during the COVID-19 pandemic.
This is the first in a series of three blog posts that explore the effects of COVID-19, detailing how it has changed remote work, user behavior, and attacker behavior.
Remote work
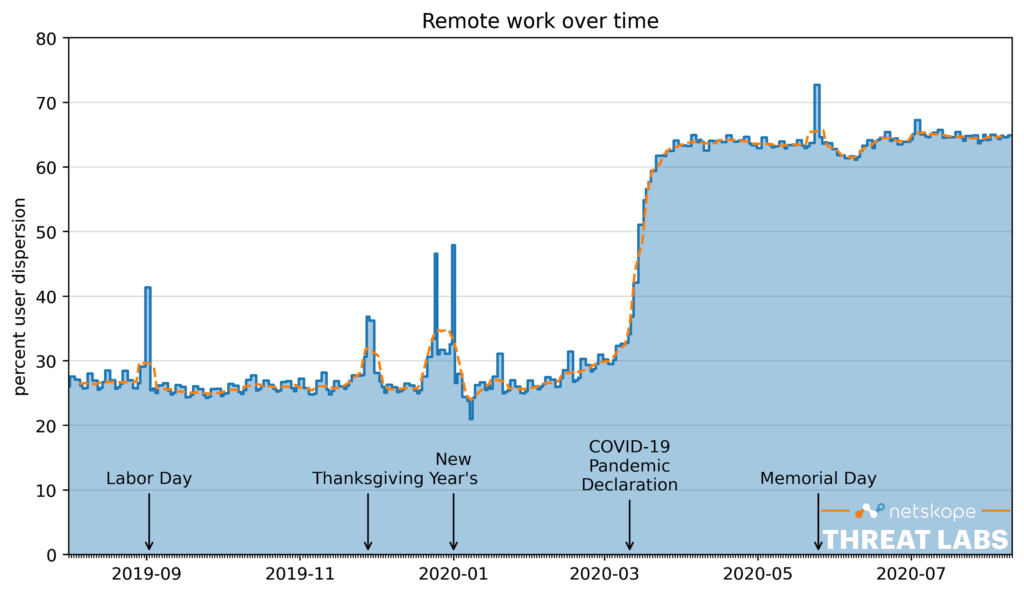
The COVID-19 pandemic caused a sudden shift to remote work in March 2020. Figure 1 shows the daily dispersion of users on the Netskope platform over the past year. User dispersion is the number of source IP addresses divided by the number of users. If the users are all on the same network, this number approaches 0%, and if all users are on different networks, this number approaches 100%. We use this number as a proxy for the percentage of users that are working remotely. The labeled spikes in the figure correspond to major holidays, on which fewer users tend to be active and those users that are active tend to work remotely.
The COVID-19 pandemic caused the number of people working remotely to increase by 148%. Prior to the pandemic, 26% of users worked remotely on an average weekday. During the pandemic, this increased to 64%. The percentage of remote workers has remained steady over the past five months, indicating that users covered by the Netskope Security Cloud platform—primarily knowledge workers—have not been affected by the recent easing of restrictions. This trend indicates that knowledge workers are likely to continue working remotely in the coming months, and based on guidance from companies like Google, midway through 2021.
Industry breakdown
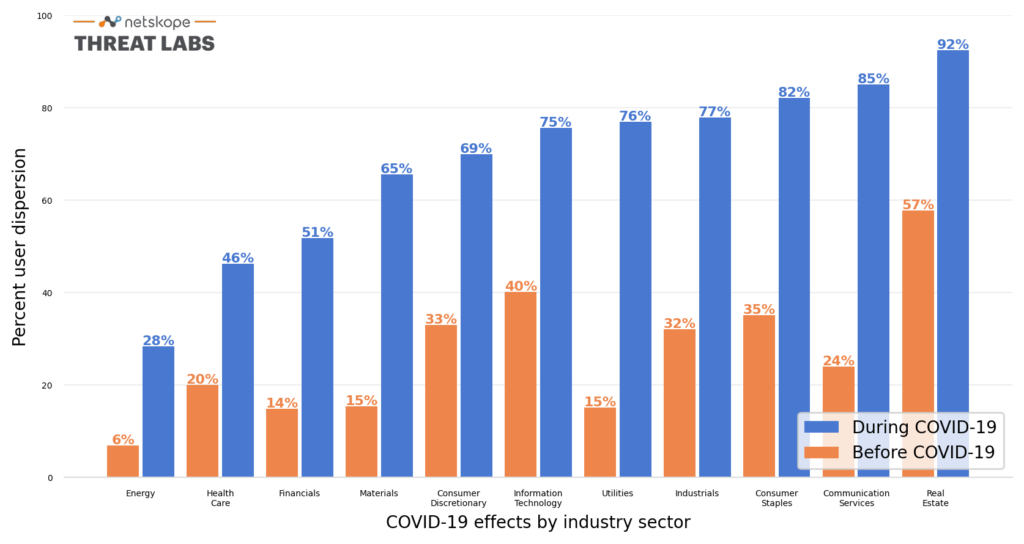
The increase in remote work caused by the COVID-19 pandemic varies by industry sector. The Global Industry Classification Standard (GICS) defines 11 industry sectors. Figure 2 shows the median daily user dispersion before and after the pandemic declaration in each of the sectors. With the exception of “Information Technology” and “Real Estate” (the two sectors with the highest pre-COVID remote work percentages), the number of users working remotely in every sector more than doubled.
“Energy” and “Health Care” trailed other sectors previously and continue to trail the other sectors during the pandemic. For many working in these sectors, their jobs have been classified as “essential.” Many in those sectors also work with specialized equipment that requires them to work from the office. As a result, we see fewer than half of all users working remotely in those sectors. At the other end, “Real Estate” users require no such specialty equipment, have not been classified as “essential,” and therefore see the highest remote work percentage.
Geography breakdown
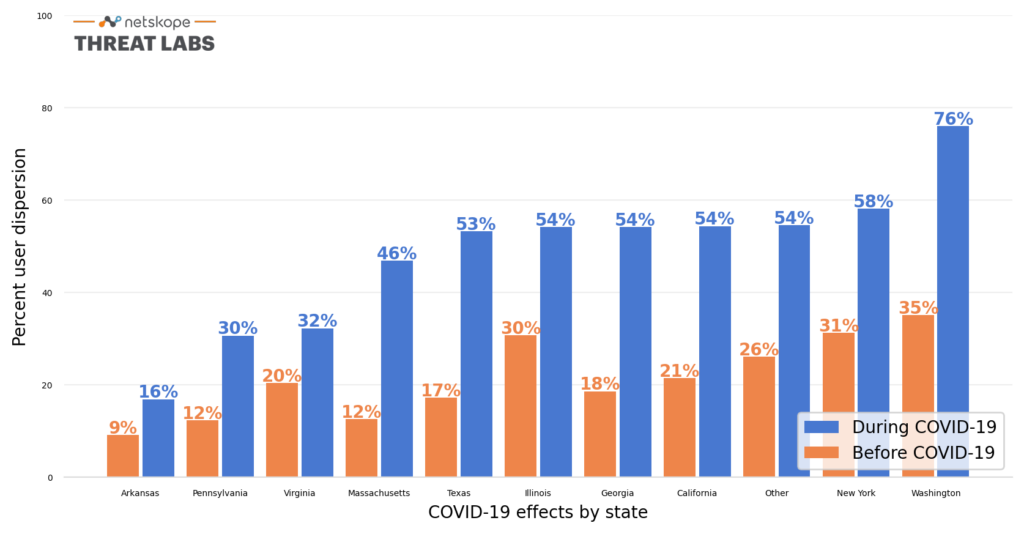
The increase in remote work caused by COVID-19 also varies significantly geographically. In the U.S., the response is largely determined at the state and local level. Figure 3 shows a breakdown in remote work numbers for the top 10 U.S. states by number of users, with the remaining 40 combined as “Other” for comparison. While every state experienced an increase, the magnitude of the increase varied significantly. Washington and New York, two states that experienced early spikes in COVID-19 cases, responded with the highest percentage of remote workers. At the other end, Arkansas saw very few cases early on and has the lowest remote work percentage.
Data analysis
The analysis presented in this blog post is based on anonymized usage data collected by the Netskope Security Cloud platform relating to a subset of Netskope customers with prior authorization.
Conclusion
COVID-19 caused a sudden and dramatic increase in remote work that has sustained for five months and is poised to continue for many more. While this increase happened across the board, affecting information workers in all industries and all geographies, the magnitude of the effect varied significantly. Industries that have been deemed essential or require specialized equipment tend to have much lower remote work numbers compared to other industries, and regions more severely affected by the virus tend to have higher remote work numbers compared to those that have been relatively unaffected or have only recently begun to feel the effects.
The next installment in this series will explore in more detail how the increase in remote work has changed user behavior, including causing an increase in risky behavior. To learn more about recent trends in cloud adoption and security threats from the first half of 2020, please refer to our August 2020 Cloud and Threat Report.